메모
전체 예제 코드를 다운로드 하려면 여기 를 클릭 하십시오.
등고선 레이블 데모 #
등고선 레이블로 수행할 수 있는 고급 작업 중 일부를 설명합니다.
컨투어 데모 예제 도 참조하십시오 .
import numpy as np
import matplotlib.ticker as ticker
import matplotlib.pyplot as plt
표면 정의
사용자 정의 수준 포맷터로 등고선 레이블 만들기
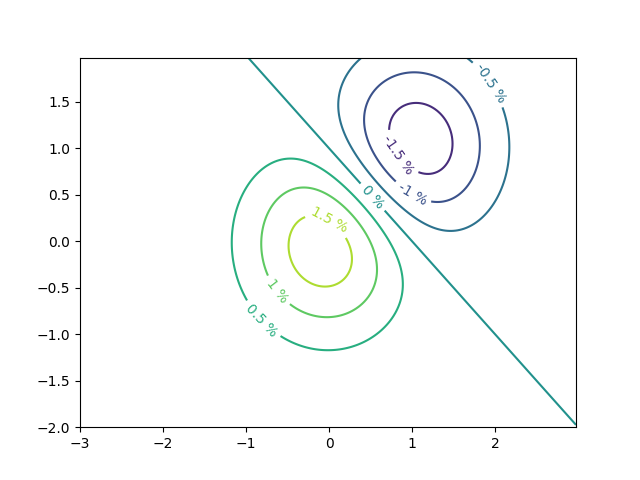
# This custom formatter removes trailing zeros, e.g. "1.0" becomes "1", and
# then adds a percent sign.
def fmt(x):
    s = f"{x:.1f}"
    if s.endswith("0"):
        s = f"{x:.0f}"
    return rf"{s} \%" if plt.rcParams["text.usetex"] else f"{s} %"


# Basic contour plot
fig, ax = plt.subplots()
CS = ax.contour(X, Y, Z)

ax.clabel(CS, CS.levels, inline=True, fmt=fmt, fontsize=10)
<a list of 7 text.Text objects>
사전을 사용하여 임의의 문자열로 등고선 레이블 지정
fig1, ax1 = plt.subplots()

# Basic contour plot
CS1 = ax1.contour(X, Y, Z)

fmt = {}
strs = ['first', 'second', 'third', 'fourth', 'fifth', 'sixth', 'seventh']
for l, s in zip(CS1.levels, strs):
    fmt[l] = s

# Label every other level using strings
ax1.clabel(CS1, CS1.levels[::2], inline=True, fmt=fmt, fontsize=10)
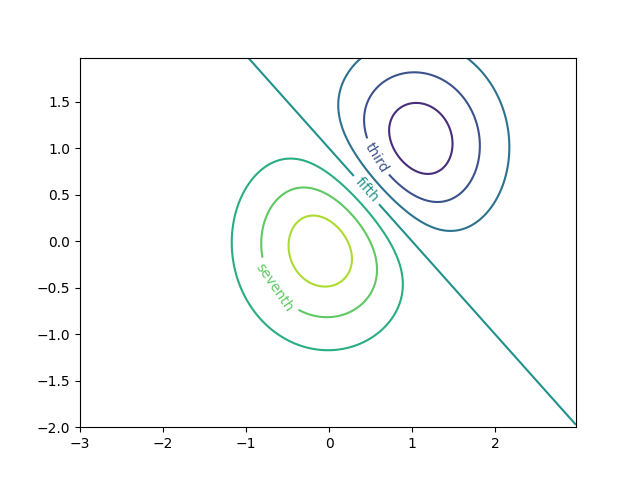
<a list of 3 text.Text objects>
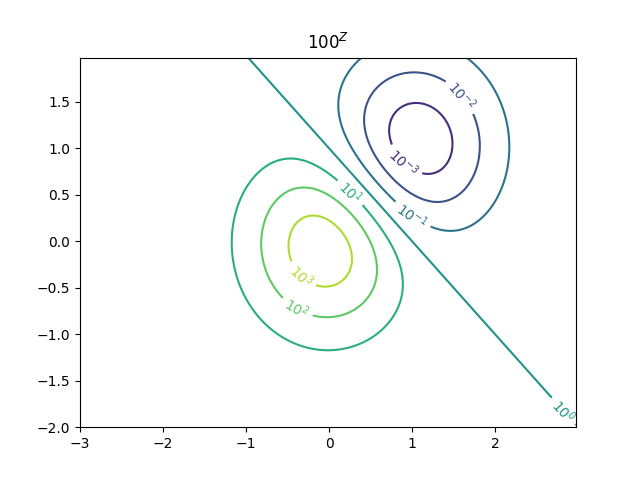
포맷터 사용
fig2, ax2 = plt.subplots()

CS2 = ax2.contour(X, Y, 100**Z, locator=plt.LogLocator())
fmt = ticker.LogFormatterMathtext()
fmt.create_dummy_axis()
ax2.clabel(CS2, CS2.levels, fmt=fmt)
ax2.set_title("$100^Z$")

plt.show()
참조
다음 함수, 메서드, 클래스 및 모듈의 사용이 이 예제에 표시됩니다.
스크립트의 총 실행 시간: (0분 1.443초)