메모
전체 예제 코드를 다운로드 하려면 여기 를 클릭 하십시오.
사용자 지정 기호가 있는 산점도 #
TeX 기호 사용 #
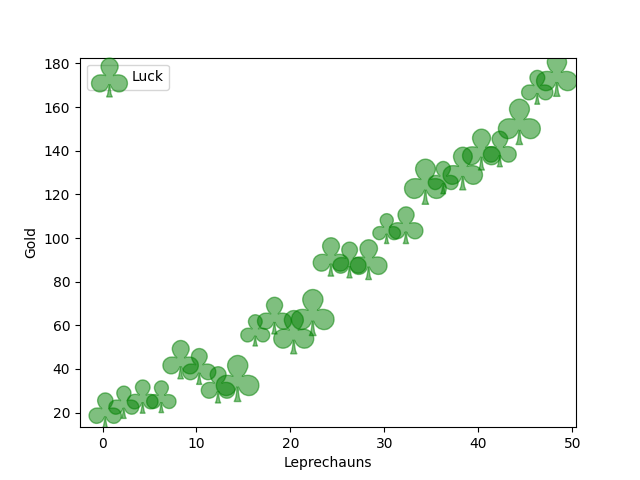
스캐터 기호를 사용자 지정하는 쉬운 방법은 $ 기호로 묶인 TeX 기호 이름을 마커로 전달하는 것입니다. 아래에서 우리는 marker=r'$\clubsuit$'.
import matplotlib.pyplot as plt
import numpy as np

# Fixing random state for reproducibility
np.random.seed(19680801)


x = np.arange(0.0, 50.0, 2.0)
y = x ** 1.3 + np.random.rand(*x.shape) * 30.0
sizes = np.random.rand(*x.shape) * 800 + 500

fig, ax = plt.subplots()
ax.scatter(x, y, sizes, c="green", alpha=0.5, marker=r'$\clubsuit$',
           label="Luck")
ax.set_xlabel("Leprechauns")
ax.set_ylabel("Gold")
ax.legend()
plt.show()

사용자 지정 경로 사용 #
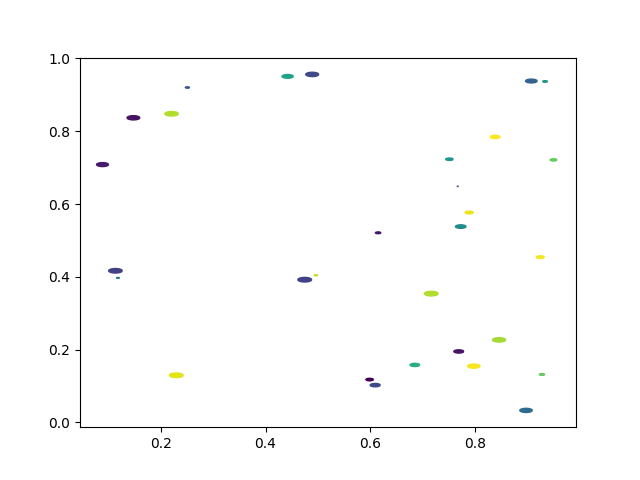
또는 N 꼭짓점의 사용자 지정 경로를 x, y 값의 Nx2 배열로 marker 로 전달할 수도 있습니다 .
# unit area ellipse
rx, ry = 3., 1.
area = rx * ry * np.pi
theta = np.arange(0, 2 * np.pi + 0.01, 0.1)
verts = np.column_stack([rx / area * np.cos(theta), ry / area * np.sin(theta)])

x, y, s, c = np.random.rand(4, 30)
s *= 10**2.

fig, ax = plt.subplots()
ax.scatter(x, y, s, c, marker=verts)

plt.show()
