메모
전체 예제 코드를 다운로드 하려면 여기 를 클릭 하십시오.
극축의 산점도 #
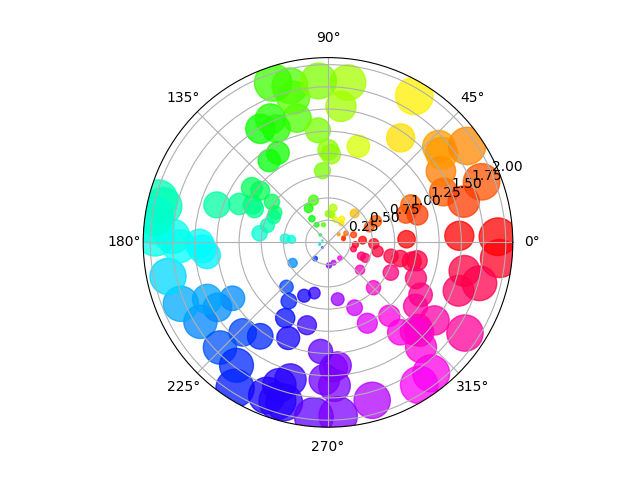
이 예에서는 크기가 방사형으로 증가하고 색상은 각도에 따라 증가합니다(기호가 올바르게 분산되는지 확인하기 위한 것임).
import numpy as np
import matplotlib.pyplot as plt


# Fixing random state for reproducibility
np.random.seed(19680801)

# Compute areas and colors
N = 150
r = 2 * np.random.rand(N)
theta = 2 * np.pi * np.random.rand(N)
area = 200 * r**2
colors = theta

fig = plt.figure()
ax = fig.add_subplot(projection='polar')
c = ax.scatter(theta, r, c=colors, s=area, cmap='hsv', alpha=0.75)

오프셋 원점이 있는 극축의 산점도 #
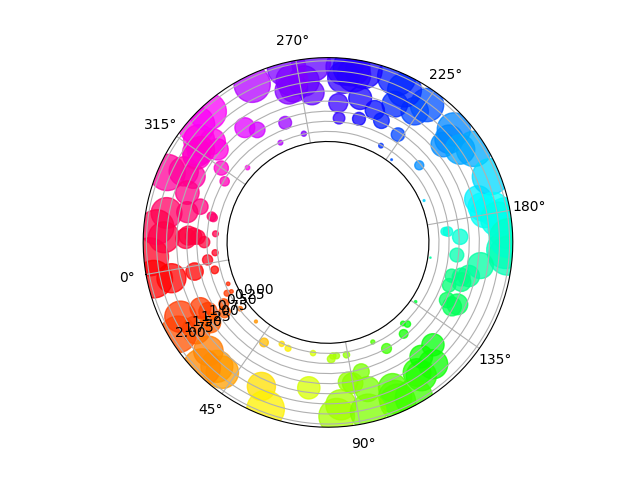
이전 플롯과의 주요 차이점은 환형을 생성하는 원점 반경의 구성입니다. 또한 세타 영점 위치는 플롯을 회전하도록 설정됩니다.
fig = plt.figure()
ax = fig.add_subplot(projection='polar')
c = ax.scatter(theta, r, c=colors, s=area, cmap='hsv', alpha=0.75)

ax.set_rorigin(-2.5)
ax.set_theta_zero_location('W', offset=10)

섹터에 국한된 극축의 산점도 #
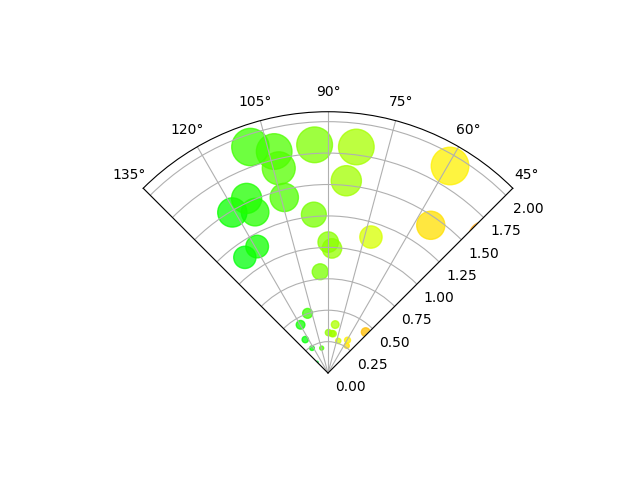
이전 플롯과의 주요 차이점은 전체 원 대신 섹터를 생성하는 세타 시작 및 끝 제한의 구성입니다.
fig = plt.figure()
ax = fig.add_subplot(projection='polar')
c = ax.scatter(theta, r, c=colors, s=area, cmap='hsv', alpha=0.75)

ax.set_thetamin(45)
ax.set_thetamax(135)

plt.show()

참조
다음 함수, 메서드, 클래스 및 모듈의 사용이 이 예제에 표시됩니다.
스크립트의 총 실행 시간: ( 0분 1.739초)