메모
전체 예제 코드를 다운로드 하려면 여기 를 클릭 하십시오.
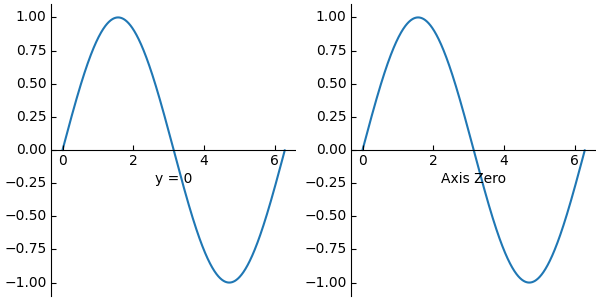
axisartist를 사용한 사용자 정의 척추 #
이 예제는 axisartist사용자 지정 위치(여기서는 )에서 스파인을 그리는 데 사용하는 방법을 보여줍니다 .y = 0
그러나 화살표가 있는 중앙 스파인 에Spine 설명된 대로 표준 방법을
사용하여 이 효과를 얻는 것이 더 간단합니다
.

import matplotlib.pyplot as plt
from mpl_toolkits import axisartist
import numpy as np


fig = plt.figure(figsize=(6, 3), constrained_layout=True)
# To construct axes of two different classes, we need to use gridspec (or
# MATLAB-style add_subplot calls).
gs = fig.add_gridspec(1, 2)


ax0 = fig.add_subplot(gs[0, 0], axes_class=axisartist.Axes)
# Make a new axis along the first (x) axis which passes through y=0.
ax0.axis["y=0"] = ax0.new_floating_axis(nth_coord=0, value=0,
                                        axis_direction="bottom")
ax0.axis["y=0"].toggle(all=True)
ax0.axis["y=0"].label.set_text("y = 0")
# Make other axis invisible.
ax0.axis["bottom", "top", "right"].set_visible(False)


# Alternatively, one can use AxesZero, which automatically sets up two
# additional axis, named "xzero" (the y=0 axis) and "yzero" (the x=0 axis).
ax1 = fig.add_subplot(gs[0, 1], axes_class=axisartist.axislines.AxesZero)
# "xzero" and "yzero" default to invisible; make xzero axis visible.
ax1.axis["xzero"].set_visible(True)
ax1.axis["xzero"].label.set_text("Axis Zero")
# Make other axis invisible.
ax1.axis["bottom", "top", "right"].set_visible(False)


# Draw some sample data.
x = np.arange(0, 2*np.pi, 0.01)
ax0.plot(x, np.sin(x))
ax1.plot(x, np.sin(x))

plt.show()