메모
전체 예제 코드를 다운로드 하려면 여기 를 클릭 하십시오.
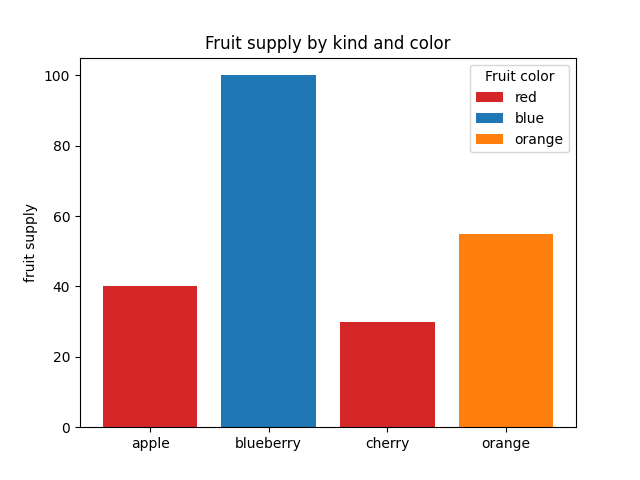
막대 색상 데모 #
의 색상 및 레이블 매개변수를 사용하여 막대 색상 및 범례 항목을 제어하는 방법을 보여주는 예 입니다 bar. 선행 밑줄이 있는 레이블은 범례에 표시되지 않습니다.
import matplotlib.pyplot as plt

fig, ax = plt.subplots()

fruits = ['apple', 'blueberry', 'cherry', 'orange']
counts = [40, 100, 30, 55]
bar_labels = ['red', 'blue', '_red', 'orange']
bar_colors = ['tab:red', 'tab:blue', 'tab:red', 'tab:orange']

ax.bar(fruits, counts, label=bar_labels, color=bar_colors)

ax.set_ylabel('fruit supply')
ax.set_title('Fruit supply by kind and color')
ax.legend(title='Fruit color')

plt.show()