메모
전체 예제 코드를 다운로드 하려면 여기 를 클릭 하십시오.
기본 눈금 포맷터 #
ScalarFormatter이 예는 다른 설정과 함께 기본값을 사용하는 것을 보여줍니다 .
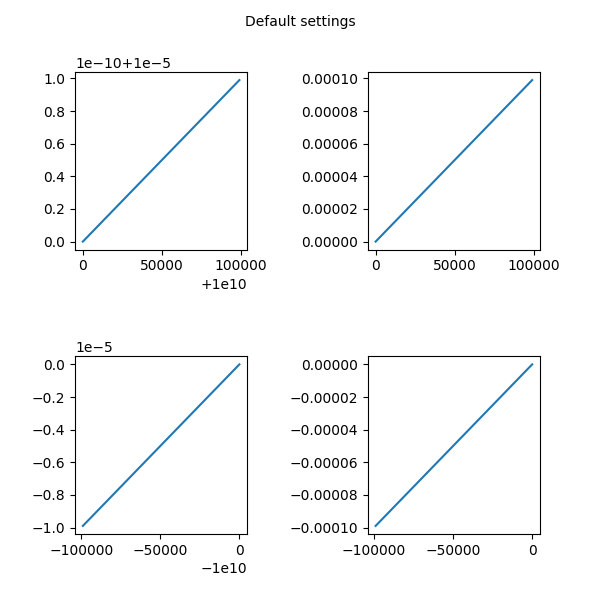
예시 1 : 기본값
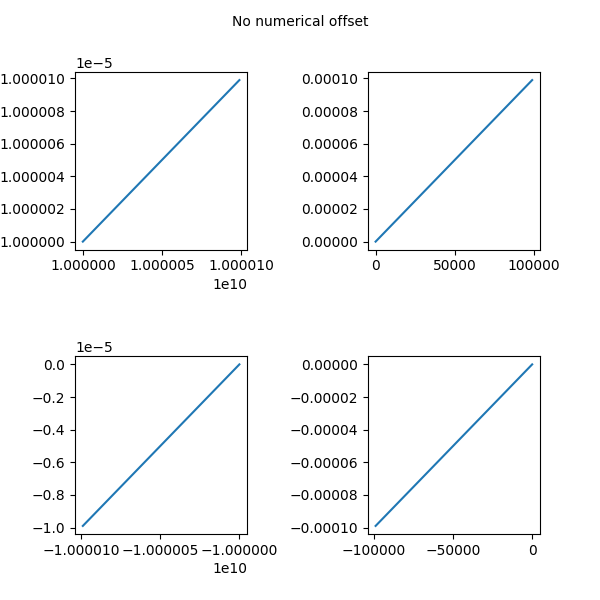
예 2 : 숫자 오프셋 없음
예 3 : Mathtext 사용
import matplotlib.pyplot as plt
import numpy as np
예 1
x = np.arange(0, 1, .01)
fig, [[ax1, ax2], [ax3, ax4]] = plt.subplots(2, 2, figsize=(6, 6))
fig.text(0.5, 0.975, 'Default settings',
         horizontalalignment='center',
         verticalalignment='top')

ax1.plot(x * 1e5 + 1e10, x * 1e-10 + 1e-5)

ax2.plot(x * 1e5, x * 1e-4)

ax3.plot(-x * 1e5 - 1e10, -x * 1e-5 - 1e-10)

ax4.plot(-x * 1e5, -x * 1e-4)

fig.subplots_adjust(wspace=0.7, hspace=0.6)
예 2
x = np.arange(0, 1, .01)
fig, [[ax1, ax2], [ax3, ax4]] = plt.subplots(2, 2, figsize=(6, 6))
fig.text(0.5, 0.975, 'No numerical offset',
         horizontalalignment='center',
         verticalalignment='top')

ax1.plot(x * 1e5 + 1e10, x * 1e-10 + 1e-5)
ax1.ticklabel_format(useOffset=False)

ax2.plot(x * 1e5, x * 1e-4)
ax2.ticklabel_format(useOffset=False)

ax3.plot(-x * 1e5 - 1e10, -x * 1e-5 - 1e-10)
ax3.ticklabel_format(useOffset=False)

ax4.plot(-x * 1e5, -x * 1e-4)
ax4.ticklabel_format(useOffset=False)

fig.subplots_adjust(wspace=0.7, hspace=0.6)
예 3
x = np.arange(0, 1, .01)
fig, [[ax1, ax2], [ax3, ax4]] = plt.subplots(2, 2, figsize=(6, 6))
fig.text(0.5, 0.975, 'With mathtext',
         horizontalalignment='center',
         verticalalignment='top')

ax1.plot(x * 1e5 + 1e10, x * 1e-10 + 1e-5)
ax1.ticklabel_format(useMathText=True)

ax2.plot(x * 1e5, x * 1e-4)
ax2.ticklabel_format(useMathText=True)

ax3.plot(-x * 1e5 - 1e10, -x * 1e-5 - 1e-10)
ax3.ticklabel_format(useMathText=True)

ax4.plot(-x * 1e5, -x * 1e-4)
ax4.ticklabel_format(useMathText=True)

fig.subplots_adjust(wspace=0.7, hspace=0.6)

plt.show()

스크립트의 총 실행 시간: ( 0분 1.866초)