메모
전체 예제 코드를 다운로드 하려면 여기 를 클릭 하십시오.
컬러바 틱 라벨링 #
컬러바에 대한 사용자 지정 레이블을 생성합니다.
Scott Sinclair 제공
import matplotlib.pyplot as plt
import numpy as np
from matplotlib import cm
from numpy.random import randn


# Fixing random state for reproducibility
np.random.seed(19680801)
세로(기본값) 컬러바를 사용하여 플롯 만들기
fig, ax = plt.subplots()

data = np.clip(randn(250, 250), -1, 1)

cax = ax.imshow(data, cmap=cm.coolwarm)
ax.set_title('Gaussian noise with vertical colorbar')

# Add colorbar, make sure to specify tick locations to match desired ticklabels
cbar = fig.colorbar(cax, ticks=[-1, 0, 1])
cbar.ax.set_yticklabels(['< -1', '0', '> 1'])  # vertically oriented colorbar
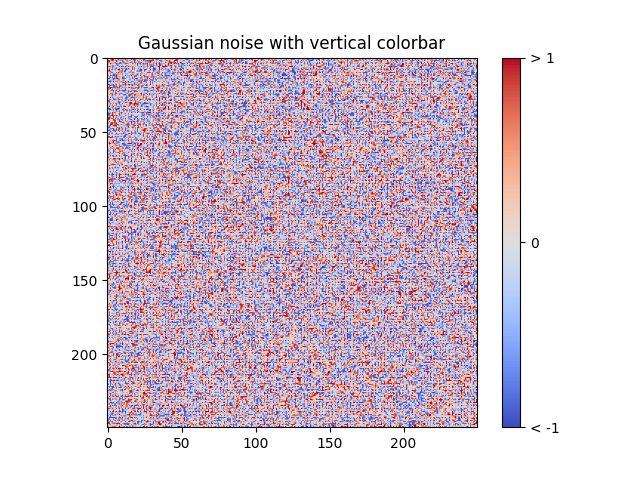
[Text(1, -1, '< -1'), Text(1, 0, '0'), Text(1, 1, '> 1')]
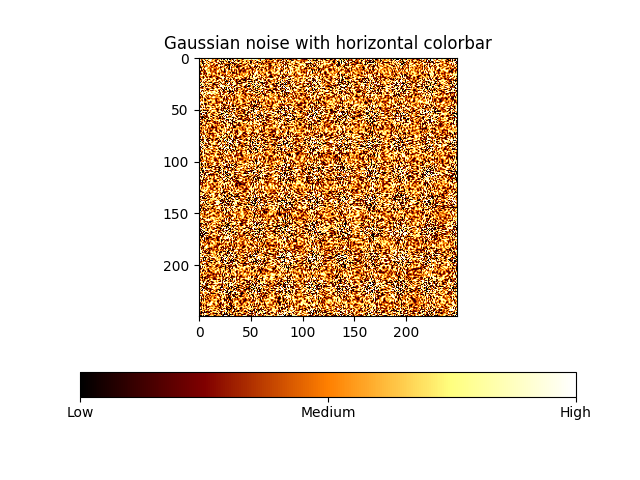
가로 색상 막대로 플롯 만들기
fig, ax = plt.subplots()

data = np.clip(randn(250, 250), -1, 1)

cax = ax.imshow(data, cmap=cm.afmhot)
ax.set_title('Gaussian noise with horizontal colorbar')

cbar = fig.colorbar(cax, ticks=[-1, 0, 1], orientation='horizontal')
cbar.ax.set_xticklabels(['Low', 'Medium', 'High'])  # horizontal colorbar

plt.show()
스크립트의 총 실행 시간: (0분 1.182초)